Report: Temkin Loyalty Index, 2016
November 15, 2016 4 Comments
 We published a Temkin Group report, Temkin Loyalty Index, 2016. This is the second year of this study that examines the loyalty of U.S. consumers to 294 companies across 20 industries. Here’s the executive summary:
The 2016 Temkin Loyalty Index (TLi) evaluates how loyal 10,000 U.S. consumers feel towards 294 companies across 20 industries. To determine companies’ TLi, we asked respondents to rate how likely they are to exhibit five loyalty-related behaviors: repurchasing from the company, recommending the company to others, forgiving the company if it makes a mistake, trusting the company, and trying the company’s new offerings. Our research shows that, of all the companies we looked at, customers feel the most loyal towards Publix, USAA, and H-E-B, and feel the least loyal towards Comcast, Motel 6, and Anthem. At the industry level, we found that supermarkets, hotels, and retailers inspire the highest levels of loyalty, while TV service providers and Internet service providers trigger the lowest levels. Meanwhile, USAA, Mercedes-Benz, and Alabama Power Company enjoy the highest levels of customer loyalty compared with their industry peers, whereas Motel 6, Citibank, and Compaq fall the furthest behind their industry peers. We also compared the results of this year’s Index with those from last year and found that the average TLi declined across all 20 industries. TV service providers declined the most, while banks declined the least. And when we narrowed in on each of the five loyalty behaviors, we found that the Trust component scores dropped most significantly. And while the vast majority of individual companies’ TLi decreased over the past year, both Con Edison of NY and Morgan Stanley Smith Barney saw their scores improve by more than nine points.
Here’s the 2015 Temkin Loyalty Index.
Download report for $295
(Includes report plus dataset in Excel. See sample spreadsheet (.xls))
![]()
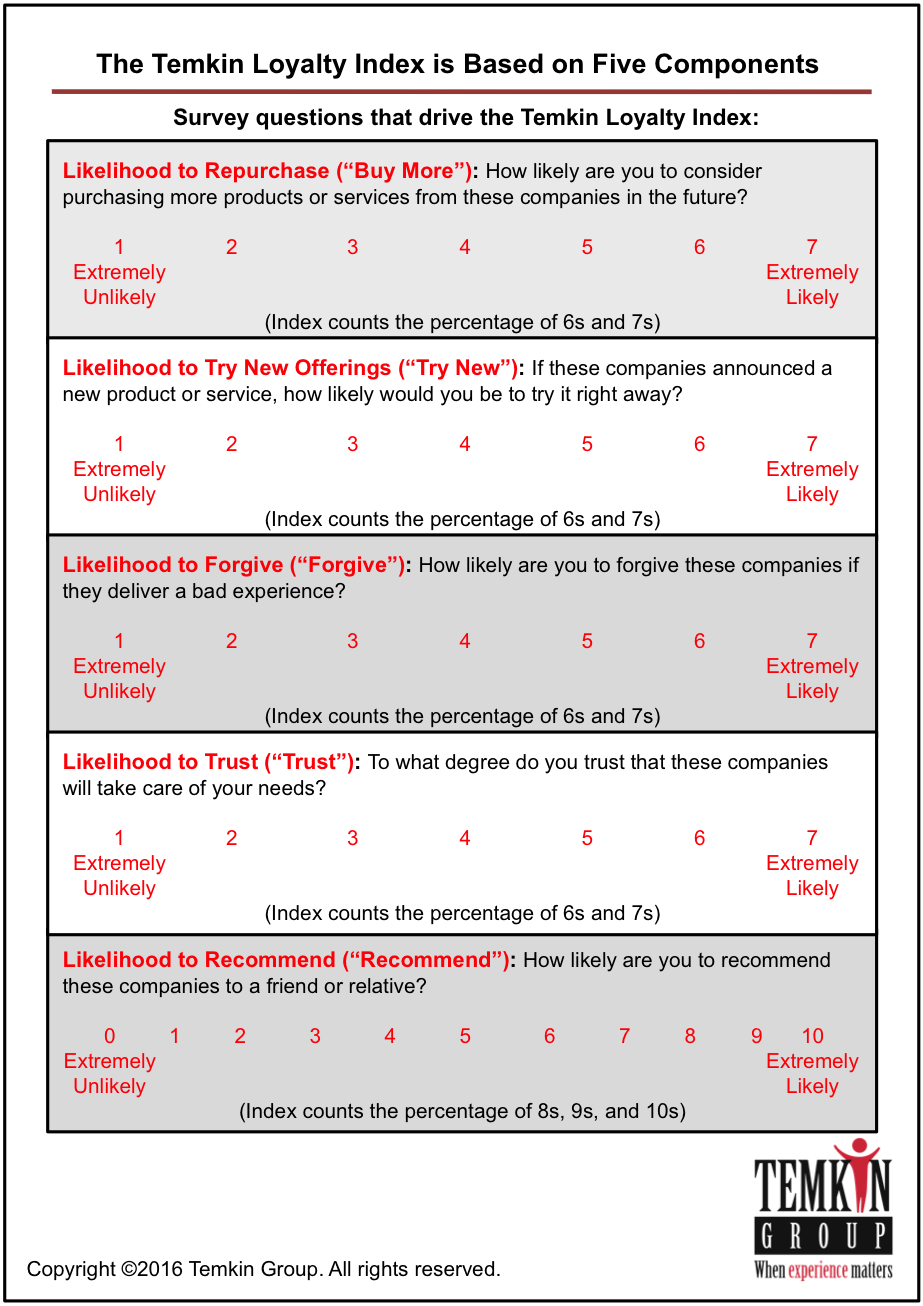
Temkin Group’s TLi is based on evaluating consumers’ likelihood to do these five things (data for these items are included in the dataset):
- Repurchase from the company
- Recommend the company to others
- Forgive the company if it makes a mistake
- Trust the company
- Try new offerings from the company
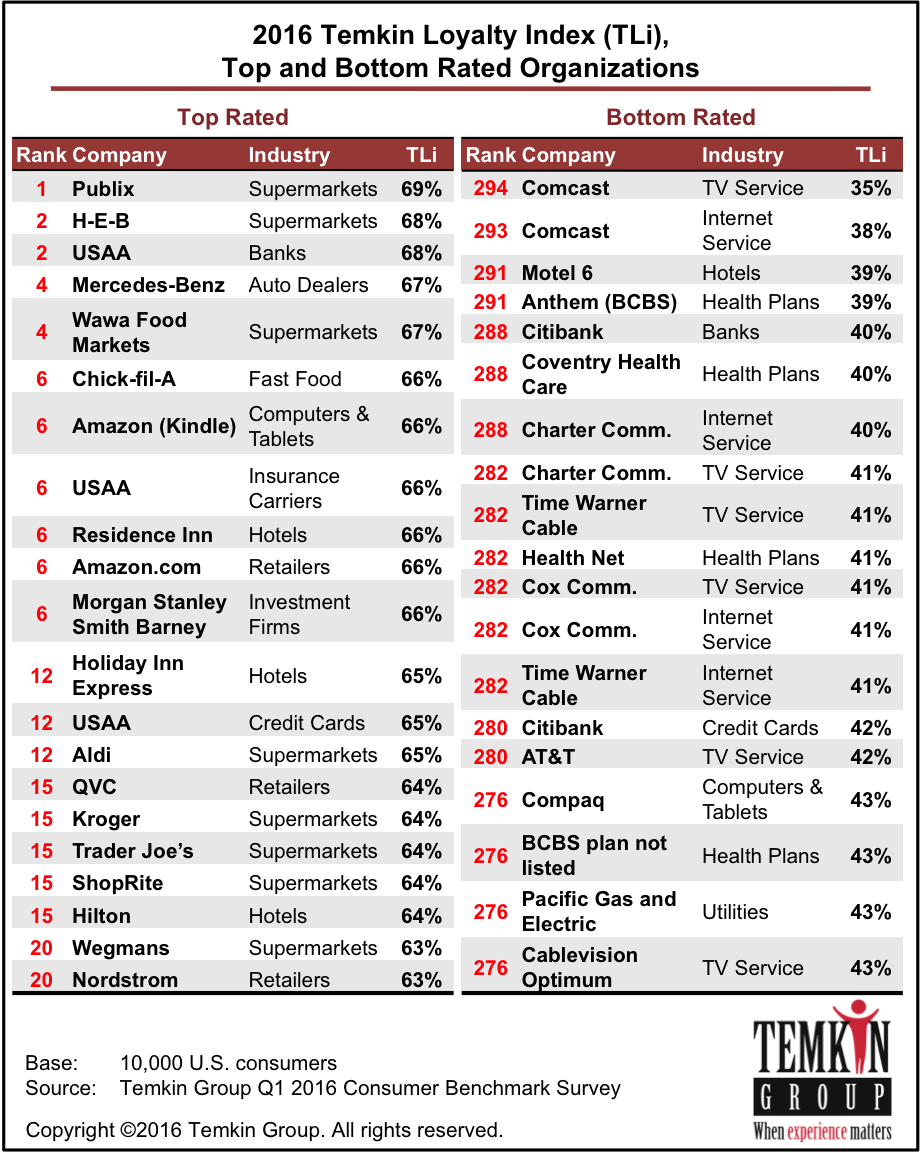
Here are the top and bottom rated companies:
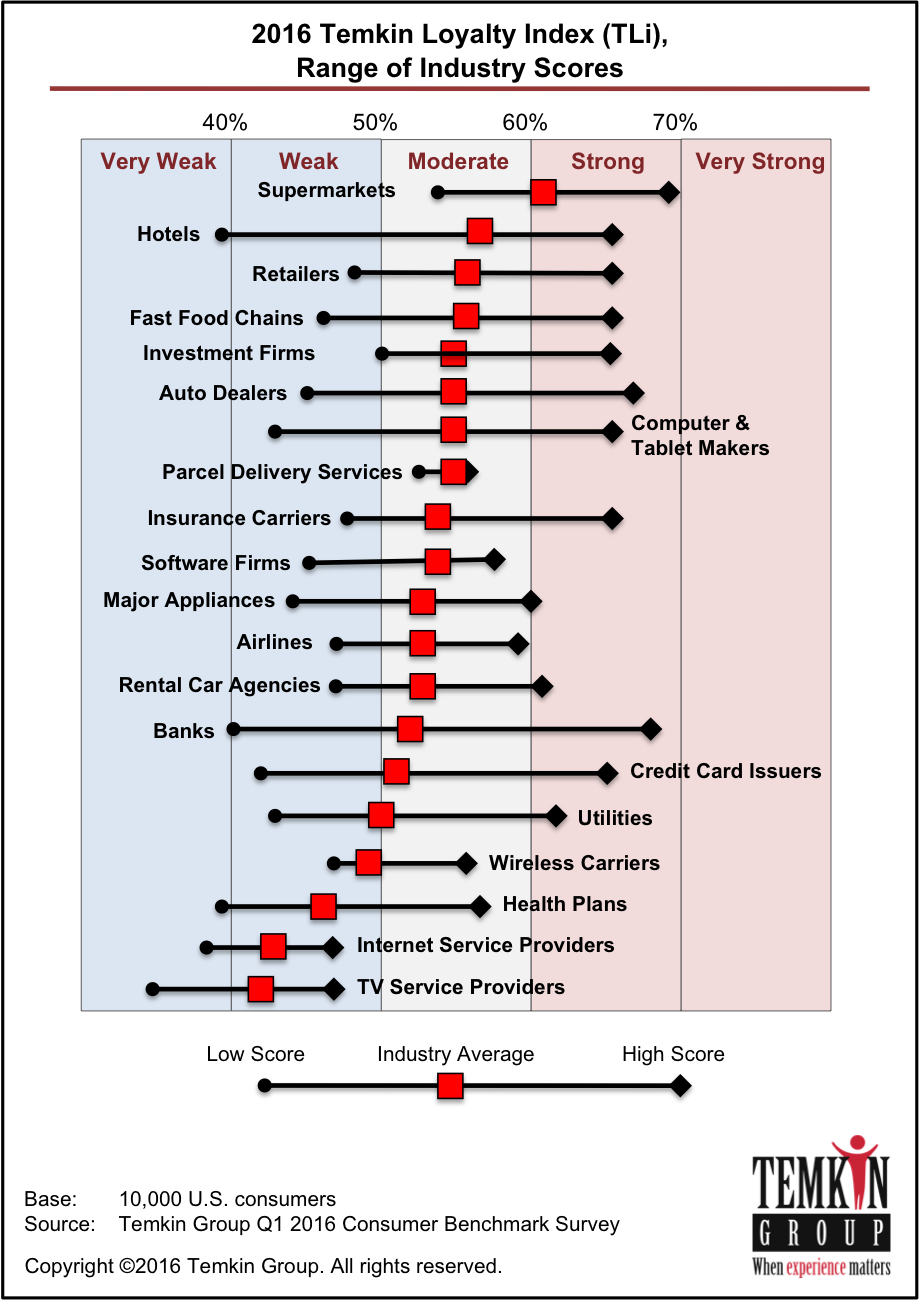
Here are the overall industry average TLi:
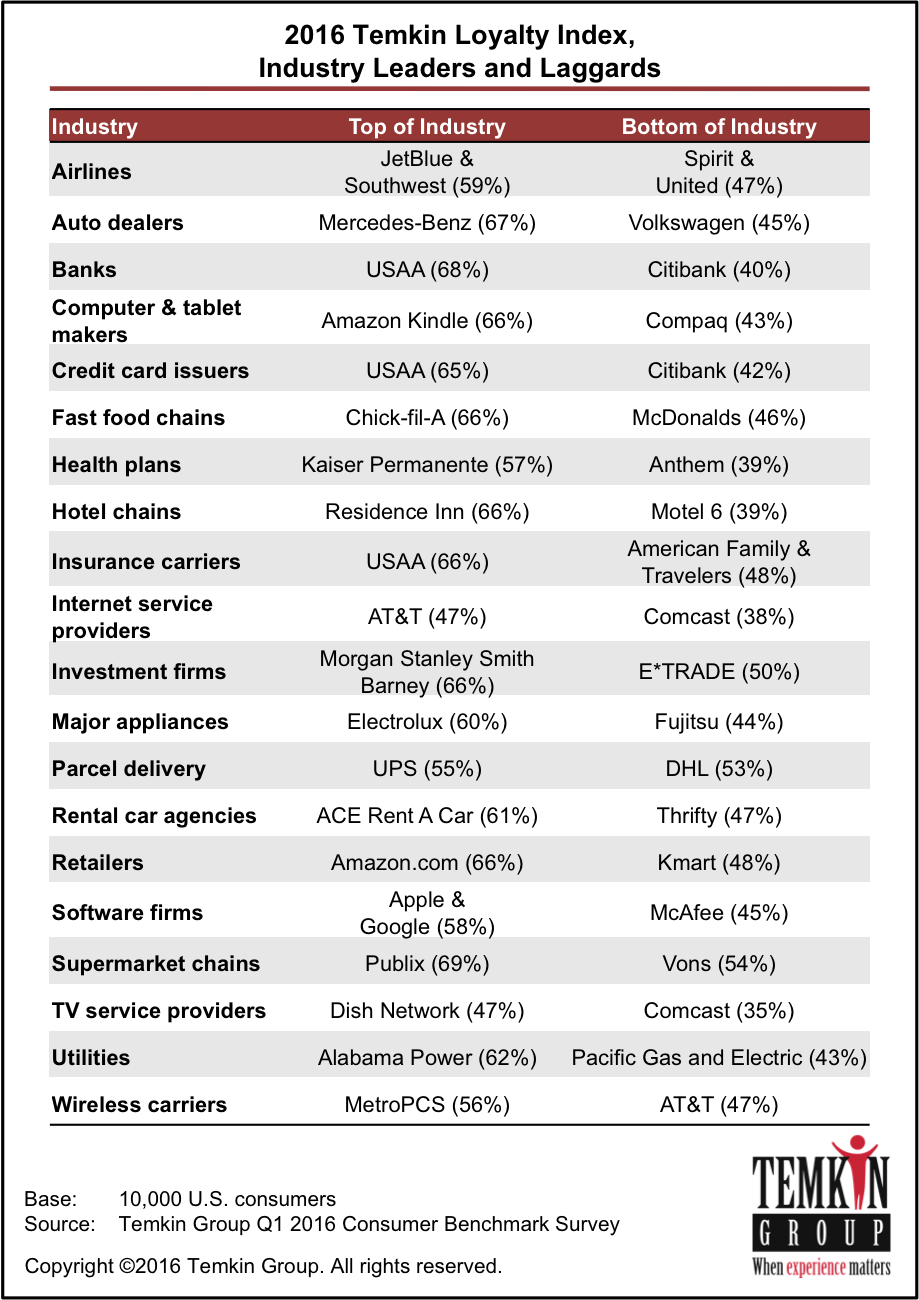
Here are the industry leaders and laggards:
Here are some additional findings:
- Loyalty levels that are most ABOVE their industry average: USAA (banks, credit cards, and insurance), Mercedes-Benz, Alabama Power Company, Amazon (Kindle), Kaiser Permanente, Chick-fil-A, and Morgan Stanley Smith Barney.
- Loyalty levels that are most BELOW their industry average: Motel 6, Citibank, Compaq, Super 8, Volkswagen, McDonalds, Fujitsu, and Days Inn.
- QVC, Publix, and Trader Joe’s lead in RECOMMENDATIONS, while Comcast, Fujitsu, and Coventry Health Plan are at the bottom.
- H-E-B, Publix, Kroger, and Trader Joe’s lead in REPURCHASING, while Fujitsu, Comcast, and HSBC fall to the bottom.
- USAA, Publix, and Morgan Stanley Smith Barney lead in FORGIVENESS, while Comcast, Motel 6, and Citibank fall to the bottom.
- ACE Rent A Car, Mercedes-Benz, and Foot Locker lead in new TRYING NEW OFFERINGS, while Comcast and Citibank are at the bottom.
- USAA, Mercedes-Benz, and Residence Inn lead in TRUST, while Comcast, Coventry Health Care, and Anthem are at the bottom.
- The research found that the average TLi for all 20 industries declined between 2015 and 2016. Banks and investment firms declined the least, while TV service providers and fast food restaurants experienced the most severe declines.
- Largest loyalty IMPROVEMENT from 2015: Con Edison of NY, Morgan Stanley Smith Barney, Mercedes-Benz, and Residence Inn.
- Largest loyalty DECLINE from 2015: Motel 6, JetBlue Airlines, GM, and Starbucks.
Download report for $295
(Includes report plus dataset in Excel. See sample spreadsheet (.xls))
![]()
Methodology
We report on companies that have feedback form at least 100 consumers who have interacted with the company over the previous 90 days. This ends up in 294 companies across 20 industries. The TLi is the average of five different measures of loyalty for each of those companies:

Hello, wondering if there’s any particular reason why the scale is made from 1-7 as opposed to be consistently 0-10 for the other 4 metrics?
To be honest, I’d rather have them all be 1 to 7 scales. We’ve found a 7-point scale to be the most representative of the actual granularity provided by respondents. We use the 0 to 10 scale for the likely to recommend question, so that we can also calculate an NPS score for other purposes.
thank you for sharing, Bruce. this is insightful. i was wondering how you calculated the final TLi? did you use the average of the response to the five components? or each factor has a different weight? thank you!
Cathy: The final TLi is an unweighted average of the individual loyalty scores.