Forrester’s US Retail Recovery Heat Map, May 2021 — Strides Toward Normalcy
In the US, the Centers for Disease Control and Prevention (CDC) reported that, between January 8 (the highest peak in the US) and May 12, the seven-day moving average of new cases decreased 85.8%. Vaccination rates are steadily increasing, and the CDC has relaxed mask guidance for vaccinated individuals.
The US is finally entering a new chapter of the pandemic: the beginning of the return to “normal.” As such, we’re adjusting our heat map model. For example, some variables — such as death rate and social distancing rates — are no longer as relevant to understand each metro area’s expected retail recovery. Our economic indicators for each metro area now include:
- Economic sentiment — based on household expected loss of income in the next four weeks
- Change in cases — 14-day percentage change in cases
- Saturation of cases — cases per 100,000 people
- Vaccine rates — percentage of population that is fully vaccinated
- Retail foot traffic — percentage change in daily retail foot traffic versus the same day two years ago
Based on our updated model, we are seeing a few trends:
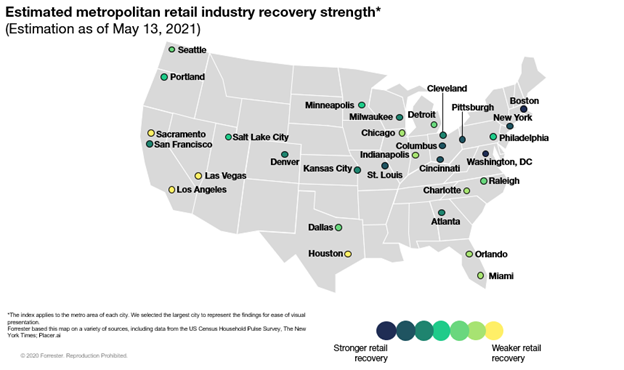
- Retail recovery is increasing in the Northeast and parts of the Midwest. This includes some of the metro areas hit hardest last year, like Boston, New York, and Washington, DC.
- Comparatively, retail recovery is lagging in parts of the South and West, including in metro areas such as Houston, Las Vegas, Los Angeles, and Sacramento.
If you would like to see the data behind these metrics or see more metropolitan areas, please contact your Forrester account representative, schedule an inquiry with me, or email Madeline Cyr, researcher, at mcyr@forrester.com.