
Coding Qualitative Data: How to Code Qualitative Research
How many hours have you spent sitting in front of Excel spreadsheets trying to find new insights from customer feedback?
You know that asking open-ended survey questions gives you more actionable insights than asking your customers for just a numerical Net Promoter Score (NPS). But when you ask open-ended, free-text questions, you end up with hundreds (or even thousands) of free-text responses.
How can you turn all of that text into quantifiable, applicable information about your customers’ needs and expectations? By coding qualitative data.
Keep reading to learn:
- What coding qualitative data means (and why it’s important)
- Different methods of coding qualitative data
- How to manually code qualitative data to find significant themes in your data
What is coding in qualitative research?
Coding is the process of labeling and organizing your qualitative data to identify different themes and the relationships between them.
When coding customer feedback, you assign labels to words or phrases that represent important (and recurring) themes in each response. These labels can be words, phrases, or numbers; we recommend using words or short phrases, since they’re easier to remember, skim, and organize.
Coding qualitative research to find common themes and concepts is part of thematic analysis. Thematic analysis extracts themes from text by analyzing the word and sentence structure.
Within the context of customer feedback, it's important to understand the many different types of qualitative feedback a business can collect, such as open-ended surveys, social media comments, reviews & more.
What is qualitative data analysis?
Qualitative data analysis is the process of examining and interpreting qualitative data to understand what it represents.
Qualitative data is defined as any non-numerical and unstructured data; when looking at customer feedback, qualitative data usually refers to any verbatim or text-based feedback such as reviews, open-ended responses in surveys, complaints, chat messages, customer interviews, case notes or social media posts
For example, NPS metric can be strictly quantitative, but when you ask customers why they gave you a rating a score, you will need qualitative data analysis methods in place to understand the comments that customers leave alongside numerical responses.
Methods of qualitative data analysis
Thematic analysis
This refers to the uncovering of themes, by analyzing the patterns and relationships in a set of qualitative data. A theme emerges or is built when related findings appear to be meaningful and there are multiple occurences. Thematic analysis can be used by anyone to transform and organize open-ended responses, online reviews and other qualitative data into significant themes.
Content analysis:
This refers to the categorization, tagging and thematic analysis of qualitative data. Essentially content analysis is a quantification of themes, by counting the occurrence of concepts, topics or themes. Content analysis can involve combining the categories in qualitative data with quantitative data, such as behavioral data or demographic data, for deeper insights.
Narrative analysis:
Some qualitative data, such as interviews or field notes may contain a story on how someone experienced something. For example, the process of choosing a product, using it, evaluating its quality and decision to buy or not buy this product next time. The goal of narrative analysis is to turn the individual narratives into data that can be coded. This is then analyzed to understand how events or experiences had an impact on the people involved.
Discourse analysis:
This refers to analysis of what people say in social and cultural context. The goal of discourse analysis is to understand user or customer behavior by uncovering their beliefs, interests and agendas. These are reflected in the way they express their opinions, preferences and experiences. It’s particularly useful when your focus is on building or strengthening a brand, by examining how they use metaphors and rhetorical devices.
Framework analysis:
When performing qualitative data analysis, it is useful to have a framework to organize the buckets of meaning. A taxonomy or code frame (a hierarchical set of themes used in coding qualitative data) is an example of the result. Don't fall into the trap of starting with a framework to make it faster to organize your data. You should look at how themes relate to each other by analyzing the data and consistently check that you can validate that themes are related to each other.
Grounded theory:
This method of analysis starts by formulating a theory around a single data case. Therefore the theory is “grounded’ in actual data. Then additional cases can be examined to see if they are relevant and can add to the original theory.
Why is it important to code qualitative data?
Coding qualitative data makes it easier to interpret customer feedback. Assigning codes to words and phrases in each response helps capture what the response is about which, in turn, helps you better analyze and summarize the results of the entire survey.
Researchers use coding and other qualitative data analysis processes to help them make data-driven decisions based on customer feedback. When you use coding to analyze your customer feedback, you can quantify the common themes in customer language. This makes it easier to accurately interpret and analyze customer satisfaction.
What is thematic coding?
Thematic coding, also called thematic analysis, is a type of qualitative data analysis that finds themes in text by analyzing the meaning of words and sentence structure.
When you use thematic coding to analyze customer feedback for example, you can learn which themes are most frequent in feedback. This helps you understand what drives customer satisfaction in an accurate, actionable way.
To learn more about how Thematic analysis software helps you automate the data coding process, check out this article.
Automated vs. Manual coding of qualitative data
Methods of coding qualitative data fall into three categories: automated coding and manual coding, and a blend of the two.
You can automate the coding of your qualitative data with thematic analysis software. Thematic analysis and qualitative data analysis software use machine learning, artificial intelligence (AI), and natural language processing (NLP) to code your qualitative data and break text up into themes.
Thematic analysis software is autonomous, which means…
- You don’t need to set up themes or categories in advance.
- You don’t need to train the algorithm — it learns on its own.
- You can easily capture the “unknown unknowns” to identify themes you may not have spotted on your own.
…all of which will save you time (and lots of unnecessary headaches) when analyzing your customer feedback.
Businesses are also seeing the benefit of using thematic analysis software. The capacity to aggregate data sources into a single source of analysis helps to break down data silos, unifying the analysis and insights across departments . This is now being referred to as Omni channel analysis or Unified Data Analytics.
Use Thematic Analysis Software
Try Thematic today to discover why leading companies rely on the platform to automate the coding of qualitative customer feedback at scale. Whether you have tons of customer reviews, support chat or open-ended survey responses, Thematic brings every valuable insight to the surface, while saving you thousands of hours.
Advances in natural language processing & machine learning have made it possible to automate the analysis of qualitative data, in particular content and framework analysis. The most commonly used software for automated coding of qualitative data is text analytics software such as Thematic.
While manual human analysis is still popular due to its perceived high accuracy, automating most of the analysis is quickly becoming the preferred choice. Unlike manual analysis, which is prone to bias and doesn’t scale to the amount of qualitative data that is generated today, automating analysis is not only more consistent and therefore can be more accurate, but can also save a ton of time, and therefore money.
Our Theme Editor tool ensures you take a reflexive approach, an important step in thematic analysis. The drag-and-drop tool makes it easy to refine, validate, and rename themes as you get more data. By guiding the AI, you can ensure your results are always precise, easy to understand and perfectly aligned with your objectives.
Thematic is the best software to automate code qualitative feedback at scale.
Don't just take it from us. Here's what some of our customers have to say:
I'm a fan of Thematic's ability to save time and create heroes. It does an excellent job using a single view to break down the verbatims into themes displayed by volume, sentiment and impact on our beacon metric, often but not exclusively NPS.
It does a superlative job using GenAI in summarizing a theme or sub-theme down to a single paragraph making it clear what folks are trying to say. Peter K, Snr Research Manager.
Thematic is a very intuitive tool to use. It boasts a robust level of granularity, allowing the user to see the general breadth of verbatim themes, dig into the sub-themes, and further into the sentiment of the open text itself. Artem C, Sr Manager of Research. LinkedIn.

Thematic
AI-powered software to transform qualitative data at scale through a thematic and content analysis.
How to manually code qualitative data
For the rest of this post, we’ll focus on manual coding. Different researchers have different processes, but manual coding usually looks something like this:
- Choose whether you’ll use deductive or inductive coding.
- Read through your data to get a sense of what it looks like. Assign your first set of codes.
- Go through your data line-by-line to code as much as possible. Your codes should become more detailed at this step.
- Categorize your codes and figure out how they fit into your coding frame.
- Identify which themes come up the most — and act on them.
Let’s break it down a little further…
Deductive coding vs. inductive coding
Before you start qualitative data coding, you need to decide which codes you’ll use.
What is Deductive Coding?
Deductive coding means you start with a predefined set of codes, then assign those codes to the new qualitative data. These codes might come from previous research, or you might already know what themes you’re interested in analyzing. Deductive coding is also called concept-driven coding.
For example, let’s say you’re conducting a survey on customer experience. You want to understand the problems that arise from long call wait times, so you choose to make “wait time” one of your codes before you start looking at the data.
The deductive approach can save time and help guarantee that your areas of interest are coded. But you also need to be careful of bias; when you start with predefined codes, you have a bias as to what the answers will be. Make sure you don’t miss other important themes by focusing too hard on proving your own hypothesis.
What is Inductive Coding?
Inductive coding, also called open coding, starts from scratch and creates codes based on the qualitative data itself. You don’t have a set codebook; all codes arise directly from the survey responses.
Here’s how inductive coding works:
- Break your qualitative dataset into smaller samples.
- Read a sample of the data.
- Create codes that will cover the sample.
- Reread the sample and apply the codes.
- Read a new sample of data, applying the codes you created for the first sample.
- Note where codes don’t match or where you need additional codes.
- Create new codes based on the second sample.
- Go back and recode all responses again.
- Repeat from step 5 until you’ve coded all of your data.
If you add a new code, split an existing code into two, or change the description of a code, make sure to review how this change will affect the coding of all responses. Otherwise, the same responses at different points in the survey could end up with different codes.
Sounds like a lot of work, right? Inductive coding is an iterative process, which means it takes longer and is more thorough than deductive coding. A major advantage is that it gives you a more complete, unbiased look at the themes throughout your data.
Combining inductive and deductive coding
In practice, most researchers use a blend of inductive and deductive approaches to coding.
For example, with Thematic, the AI inductively comes up with themes, while also framing the analysis so that it reflects how business decisions are made. At the end of the analysis, researchers use the Theme Editor to iterate or refine themes. Then, in the next wave of analysis, as new data comes in, the AI starts deductively with the theme taxonomy.
Categorize your codes with coding frames
Once you create your codes, you need to put them into a coding frame. A coding frame represents the organizational structure of the themes in your research. There are two types of coding frames: flat and hierarchical.
Flat Coding Frame
A flat coding frame assigns the same level of specificity and importance to each code. While this might feel like an easier and faster method for manual coding, it can be difficult to organize and navigate the themes and concepts as you create more and more codes. It also makes it hard to figure out which themes are most important, which can slow down decision making.
Hierarchical Coding Frame
Hierarchical frames help you organize codes based on how they relate to one another. For example, you can organize the codes based on your customers’ feelings on a certain topic:
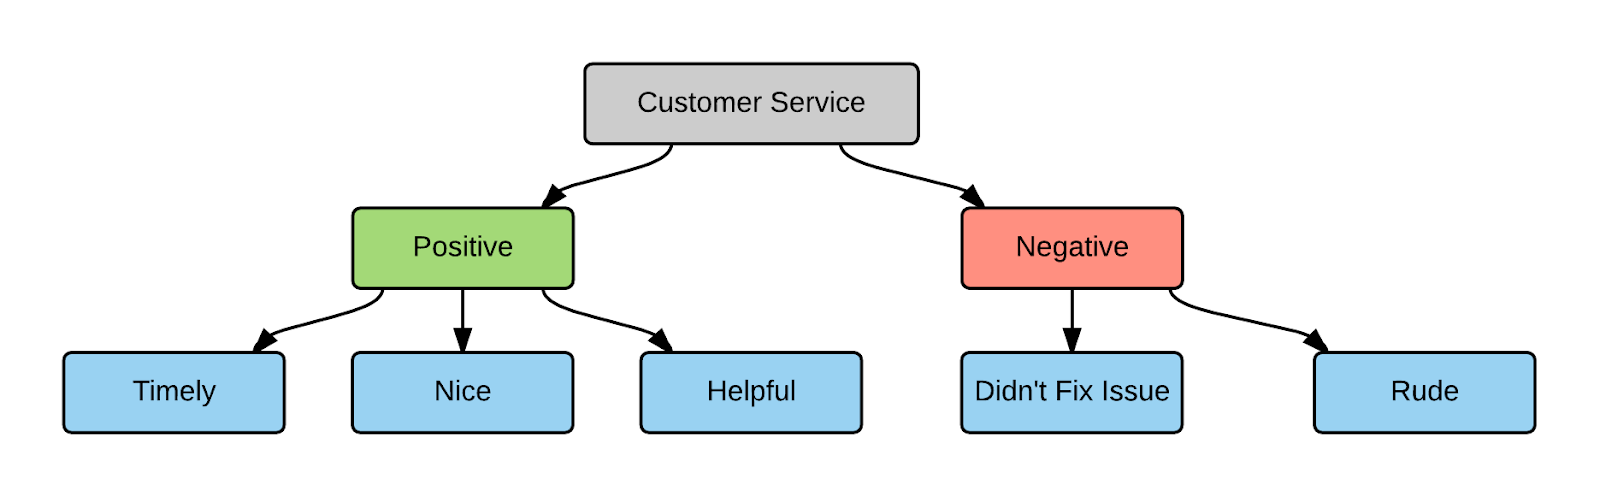
In this example:
- The top-level code describes the topic (customer service)
- The mid-level code specifies whether the sentiment is positive or negative
- The third level details the attribute or specific theme associated with the topic
Hierarchical framing supports a larger code frame and lets you organize codes based on organizational structure. It also allows for different levels of granularity in your coding.
Whether your code frames are hierarchical or flat, your code frames should be flexible. Manually analyzing survey data takes a lot of time and effort; make sure you can use your results in different contexts.
For example, if your survey asks customers about customer service, you might only use codes that capture answers about customer service. Then you realize that the same survey responses have a lot of comments about your company’s products. To learn more about what people say about your products, you may have to code all of the responses from scratch! A flexible coding frame covers different topics and insights, which lets you reuse the results later on.
Tips for manually coding qualitative data
Now that you know the basics of coding your qualitative data, here are some tips on making the most of your qualitative research.
Use a codebook to keep track of your codes
As you code more and more data, it can be hard to remember all of your codes off the top of your head. Tracking your codes in a codebook helps keep you organized throughout the data analysis process. Your codebook can be as simple as an Excel spreadsheet or word processor document. As you code new data, add new codes to your codebook and reorganize categories and themes as needed.
Make sure to track:
- The label used for each code
- A description of the concept or theme the code refers to
- Who originally coded it
- The date that it was originally coded or updated
- Any notes on how the code relates to other codes in your analysis
How to create high-quality codes - 4 tips
1. Cover as many survey responses as possible.
The code should be generic enough to apply to multiple comments, but specific enough to be useful in your analysis. For example, “Product” is a broad code that will cover a variety of responses — but it’s also pretty vague. What about the product? On the other hand, “Product stops working after using it for 3 hours” is very specific and probably won’t apply to many responses. “Poor product quality” or “short product lifespan” might be a happy medium.
2. Avoid commonalities.
Having similar codes is okay as long as they serve different purposes. “Customer service” and “Product” are different enough from one another, while “Customer service” and “Customer support” may have subtle differences but should likely be combined into one code.
3. Capture the positive and the negative.
Try to create codes that contrast with each other to track both the positive and negative elements of a topic separately. For example, “Useful product features” and “Unnecessary product features” would be two different codes to capture two different themes.
4. Reduce data — to a point.
Let’s look at the two extremes: There are as many codes as there are responses, or each code applies to every single response. In both cases, the coding exercise is pointless; you don’t learn anything new about your data or your customers. To make your analysis as useful as possible, try to find a balance between having too many and too few codes.
Group responses based on themes, not words
Make sure to group responses with the same themes under the same code, even if they don’t use the same exact wording. For example, a code such as “cleanliness” could cover responses including words and phrases like:
- Clean
- Tidy
- Dirty
- Dusty
- Looked like a dump
- Could eat off the floor
Having only a few codes and hierarchical framing makes it easier to group different words and phrases under one code. If you have too many codes, especially in a flat frame, your results can become ambiguous and themes can overlap. Manual coding also requires the coder to remember or be able to find all of the relevant codes; the more codes you have, the harder it is to find the ones you need, no matter how organized your codebook is.
Make accuracy a priority
Manually coding qualitative data means that the coder’s cognitive biases can influence the coding process. For each study, make sure you have coding guidelines and training in place to keep coding reliable, consistent, and accurate.
One thing to watch out for is definitional drift, which occurs when the data at the beginning of the data set is coded differently than the material coded later. Check for definitional drift across the entire dataset and keep notes with descriptions of how the codes vary across the results.
If you have multiple coders working on one team, have them check one another’s coding to help eliminate cognitive biases.
Conclusion: 6 main takeaways for coding qualitative data
Here are 6 final takeaways for manually coding your qualitative data:
- Coding is the process of labeling and organizing your qualitative data to identify themes. After you code your qualitative data, you can analyze it just like numerical data.
- Inductive coding (without a predefined code frame) is more difficult, but less prone to bias, than deductive coding.
- Code frames can be flat (easier and faster to use) or hierarchical (more powerful and organized).
- Your code frames need to be flexible enough that you can make the most of your results and use them in different contexts.
- When creating codes, make sure they cover several responses, contrast one another, and strike a balance between too much and too little information.
- Consistent coding = accuracy. Establish coding procedures and guidelines and keep an eye out for definitional drift in your qualitative data analysis.
Some more detail in our downloadable guide
If you’ve made it this far, you’ll likely be interested in our free guide: Best practices for analyzing open-ended questions.
The guide includes some of the topics covered in this article, and goes into some more niche details.
If your company is looking to automate your qualitative coding process, try Thematic!
If you're looking to trial multiple solutions, check out our free buyer's guide. It covers what to look for when trialing different feedback analytics solutions to ensure you get the depth of insights you need.
Happy coding!
Authored by Alyona Medelyan, PhD – Natural Language Processing & Machine Learning


