

May 19, 2023
— Alex Boland | Director of ANZ Operations at COPC Inc.
Organizations often dedicate substantial time and effort debating whether to use Customer Satisfaction (CSAT), Net Promoter Score (NPS) or Customer Effort Score (CES). Consultants have set up entire businesses profiting from this discourse. However, this ongoing argument about the “right” metric is misguided.
Competing on traditional differentiators such as product or price is increasingly difficult. The key opportunity to compete is in the experiences provided to customers. As such, it is critical to put customers at the heart of the organization (an outside-in approach). Customers who are engaged are:
- more likely to buy more products,
- more likely to repurchase the same product,
- more likely to refer their friends and family to you, and
- less likely to be sensitive to price changes.
Let’s delve into each of these most commonly used metrics.
Customer Satisfaction (CSAT)

CSAT evaluates how satisfied customers are with a particular experience. Examples include purchasing, interacting with customer service, or visiting a website. Organizations can measure CSAT using various scales. However, COPC Inc. recommends using a 5-point Likert scale.
The best practice is to measure both the percentage of customers that are satisfied and the percentage that are very dissatisfied.
Most CSAT surveys also include additional questions such as “Was your issue resolved?” or “Did the agent communicate clearly?” Ideally, these questions are the key drivers of performance, as identified with regression analysis. Regression analysis is a way of mathematically sorting out which of those questions impacts satisfaction.
Net Promoter Score (NPS)
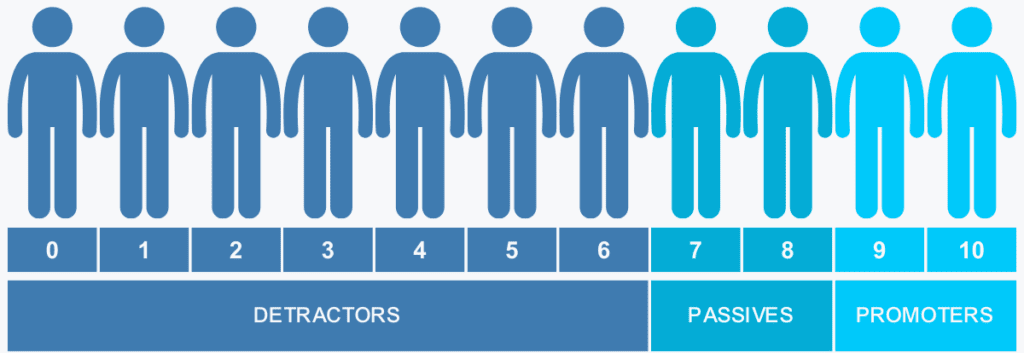
NPS measures the likelihood of a customer recommending a company’s product or service to others. It asks, “How likely are you to recommend this company, product or service to a friend or colleague?” NPS is measured on an 11-point scale from zero to ten. Customers scoring zero to six are considered detractors, seven to eight are passives, and nine to ten are promoters.
The NPS score is calculated by subtracting the percentage of detractors from the percentage of promoters.
For example, if:
25% are promoters
(scoring nine or ten),
25% are passives
(scoring seven or eight), and
50% are detractors
(scoring zero to six),
then the NPS score would be
25% – 50% = -25
In 2003, the book The Ultimate Question by Fred Reichheld, a partner at Bain & Company, popularized NPS. The Harvard Business Review article The One Number You Need to Grow also helped to popularize NPS. Since 2003 NPS has grown in popularity. A 2020 Fortune article estimated that nearly two-thirds of all Fortune 1000 companies use NPS.
As the popularity of NPS increased, so did the criticism. The authors of A Longitudinal Examination of Net Promoter and Firm Revenue Growth conducted research concluding that NPS was not a better performance indicator than other measurements.
Customer Effort Score (CES)
CES measures how easy or difficult customers find it to complete a task. Examples include placing an order or resolving an issue. CES scores will show areas where customers are experiencing unnecessary friction or difficulty and guide improvement efforts. CES is more commonly used for transactional experiences, like paying a bill.
Customers rate their agreement with a statement like “Company XYZ made it easy for me to resolve my issue.” The rating scale associated with the CES question ranges from Strongly Agree to Strongly Disagree on a seven-point scale.
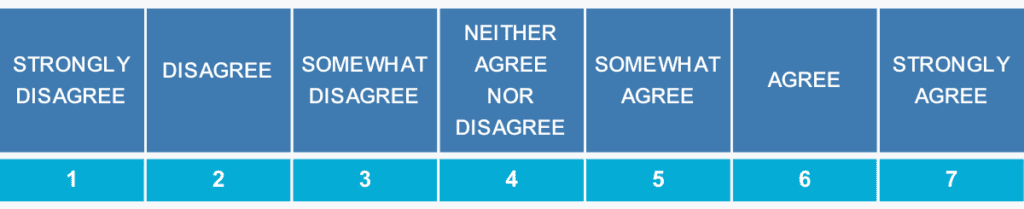
To calculate performance, either take the average of the scores received or the percentage that scored five or above. You can read more about CES in this article.
The COPC Perspective
Over the past 20+ years, I have collaborated with clients to enhance their customer experience. Many clients use multiple metrics to measure customer satisfaction. Comparing these metrics, I consistently observe a strong correlation among all three.
CSAT vs. CES
The chart on the right shows the relationship between CES and CSAT. The height of the bars represents the percentage of satisfied customers, and the categories (X-axis) show the response to the CES question. The graph shows a strong relationship between how customers score. The sample size was 2379 customers.
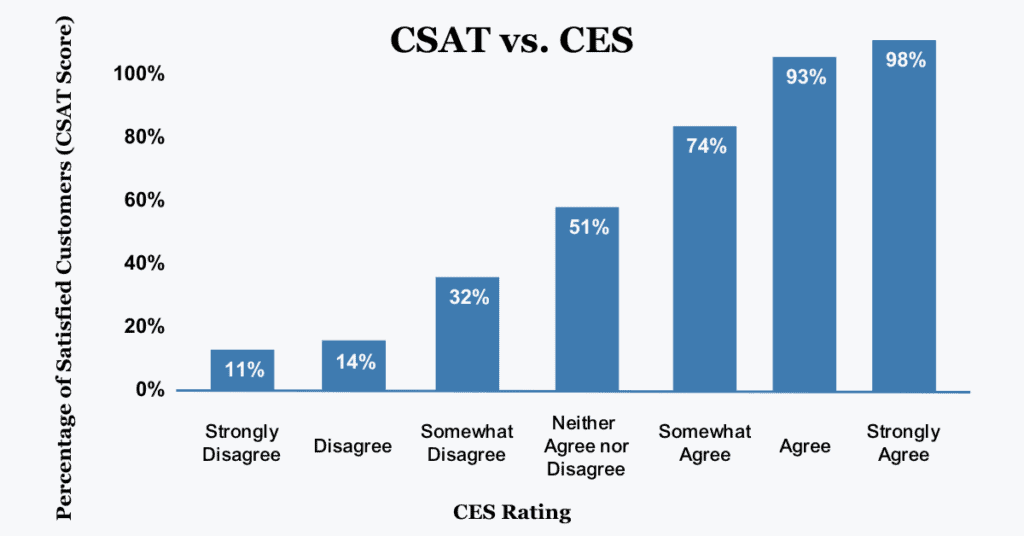
Promoters are likely satisfied customers. Promoters will likely agree that the organization quickly resolved their issue. In the same way, very dissatisfied customers are likely to disagree the organization made it easy to resolve their issues. Those dissatisfied customers are likely to be detractors.
While any of these metrics can be suitable for most organizations, I prefer CSAT. It is more widely recognized by customers and applicable across various industries. Consider if you would genuinely “recommend” a government department to your friends and family. Instead of having long discussions about the right metric, organizations should invest their time and effort in root cause analysis and improvement efforts.
These changes are complex; they take time, research and stakeholder engagement; however, it is where the real opportunities are. By implementing the measurements and approaches effectively, the data should provide insights into the opportunities that will drive the most significant improvements.
Therefore, the next time someone questions whether NPS would be more suitable for your organization than CSAT, redirect their attention to improvement opportunities. Simply changing the metric will not lead to improved performance!
About the Author

Alex Boland joined COPC Inc. in 2011 and became instrumental in driving customer experience improvements for clients across Australia, New Zealand, Indonesia, Singapore, Malaysia, Thailand, the Philippines, India, Sri Lanka, Hong Kong, USA, China and Korea. His vast experience working with diverse teams allowed him to effectively deliver consulting, benchmarking, training and operational auditing services.
In 2016, after spending five years defining industry standards and driving change in South East Asia from his base in Jakarta, Alex returned to Australia to spearhead the ANZ Operations as Director, elevating the company’s regional presence and influence.

You may also like the following:
Measuring the Customer Experience