article thumbnail

The Right Survey to Measure Each Touchpoint of the Customer Journey

GetFeedback

The main weakness of surveys is they tend to get input from very happy or unhappy customers. Response rates of 10% or less are common for general customer satisfaction surveys , leaving CX leaders to wonder: What do all those other customers think? Indirect or inferred feedback from analyzing customer interaction data.

article thumbnail

Three Ways to Get More Value from Your Workforce Optimization Platform

Avaya

Automated Quality Management can take your quality assurance program to the next level by automating scoring for some or all questions on an evaluation form—empowering quality managers to shift resources from scoring customer interactions to focus on coaching agents, so they can improve customer satisfaction and employee engagement.

article thumbnail

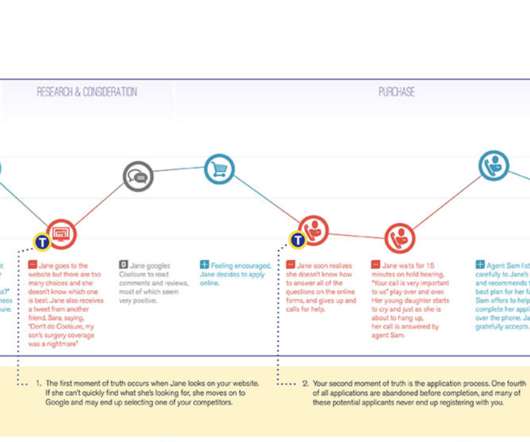
Why Do I Need Data in My Journey Maps?

CX Journey

Artifacts, including call recordings, videos, invoices, receipts, pictures, documents, screenshots, etc.